貓版文章分析(II)
Jessy Chen
/ 2019-03-29
/

library(tidyverse)

library(rjson)
library(jsonlite)

library(ggplot2)

library(lubridate)
library(scales)

library(gganimate)
library(gifski)
library(png)
# read in data
files <- c("cat-3500-4000.rds", "cat-3000-3501.rds", "cat-2500-3001.rds", "cat-2000-2501.rds")
data_lst <- lapply(files, function(x){readRDS(x)})
# check the column names of the data frame (message_count is a data frame)
names(data_lst[[1]])#> [1] "article_id" "article_title" "author"
#> [4] "board" "content" "date"
#> [7] "ip" "message_count" "messages"
#> [10] "url" "content_splited_n" "content_splited"# re-create the date frame, otherwise tidyverse will not work
data_lst <- lapply(data_lst, function(x){cbind(x %>% select(-message_count),
x$message_count)})
# convert the column "date" into POSIXct, otherwise tidyverse will not work
for(n in 1:length(data_lst)){
data_lst[[n]]$date <- as.POSIXct(data_lst[[n]]$date)}
# check the column names again
names(data_lst[[1]])#> [1] "article_id" "article_title" "author"
#> [4] "board" "content" "date"
#> [7] "ip" "messages" "url"
#> [10] "content_splited_n" "content_splited" "all"
#> [13] "boo" "count" "neutral"
#> [16] "push"# bind all the data frames together
data <- bind_rows(data_lst, .id = "column_label")
data <- data %>% mutate(date_full=as.Date(date))column_label <chr> | ||
|---|---|---|
| 1 | 1 | |
| 2 | 1 | |
| 3 | 1 | |
| 4 | 1 | |
| 5 | 1 | |
| 6 | 1 |
column_label <chr> | ||
|---|---|---|
| 40004 | 4 | |
| 40005 | 4 | |
| 40006 | 4 | |
| 40007 | 4 | |
| 40008 | 4 | |
| 40009 | 4 |
# filter articles published within the past 2 years
two_yrs_data <- data %>% filter(date>"2017-01-01"&date<="2018-12-31")

# see how many articles are published
nrow(two_yrs_data)
#> [1] 29110column_label <chr> | ||
|---|---|---|
| 1 | 1 | |
| 2 | 1 | |
| 3 | 1 | |
| 4 | 1 | |
| 5 | 1 | |
| 6 | 1 | |
| 7 | 1 | |
| 8 | 1 | |
| 9 | 1 | |
| 10 | 1 |
# plotting 1:
df1 <- two_yrs_data %>%
  group_by(date_full) %>%
  summarize(number_of_articles=length(article_id)) %>%
  mutate(date_y=year(date_full),
         date_m=month(date_full),
         date_d=day(date_full),
         date_md=format(date_full, "%m-%d")) %>%
  arrange(desc(number_of_articles))

rmarkdown::paged_table(df1[1:10,])date_full <date> | |
|---|---|
| 2017-10-15 | |
| 2017-10-14 | |
| 2017-10-12 | |
| 2017-10-11 | |
| 2017-10-16 | |
| 2017-06-05 | |
| 2017-07-09 | |
| 2017-02-22 | |
| 2018-01-04 | |
| 2017-01-22 |
df1$date_y_f <- factor(df1$date_y)
df1$date_m_f <- factor(df1$date_m)
df1$date_d_f <- factor(df1$date_d)
df1$date_md_f <- factor(df1$date_md)

p1 <- ggplot(df1, aes(date_md, number_of_articles, group=date_m_f, color=date_y_f)) +
  geom_line() +
  labs(title = "Number of articles published on PTT Cat board",
       x = "Month-Day", y = "Number of articles",
       color = "Year")

p1
# another way of extracting the day, month, and year
df <- df %>%
  mutate(date = ymd(date)) %>%
  mutate_at(vars(date), funs(year, month, day))
# plotting 2
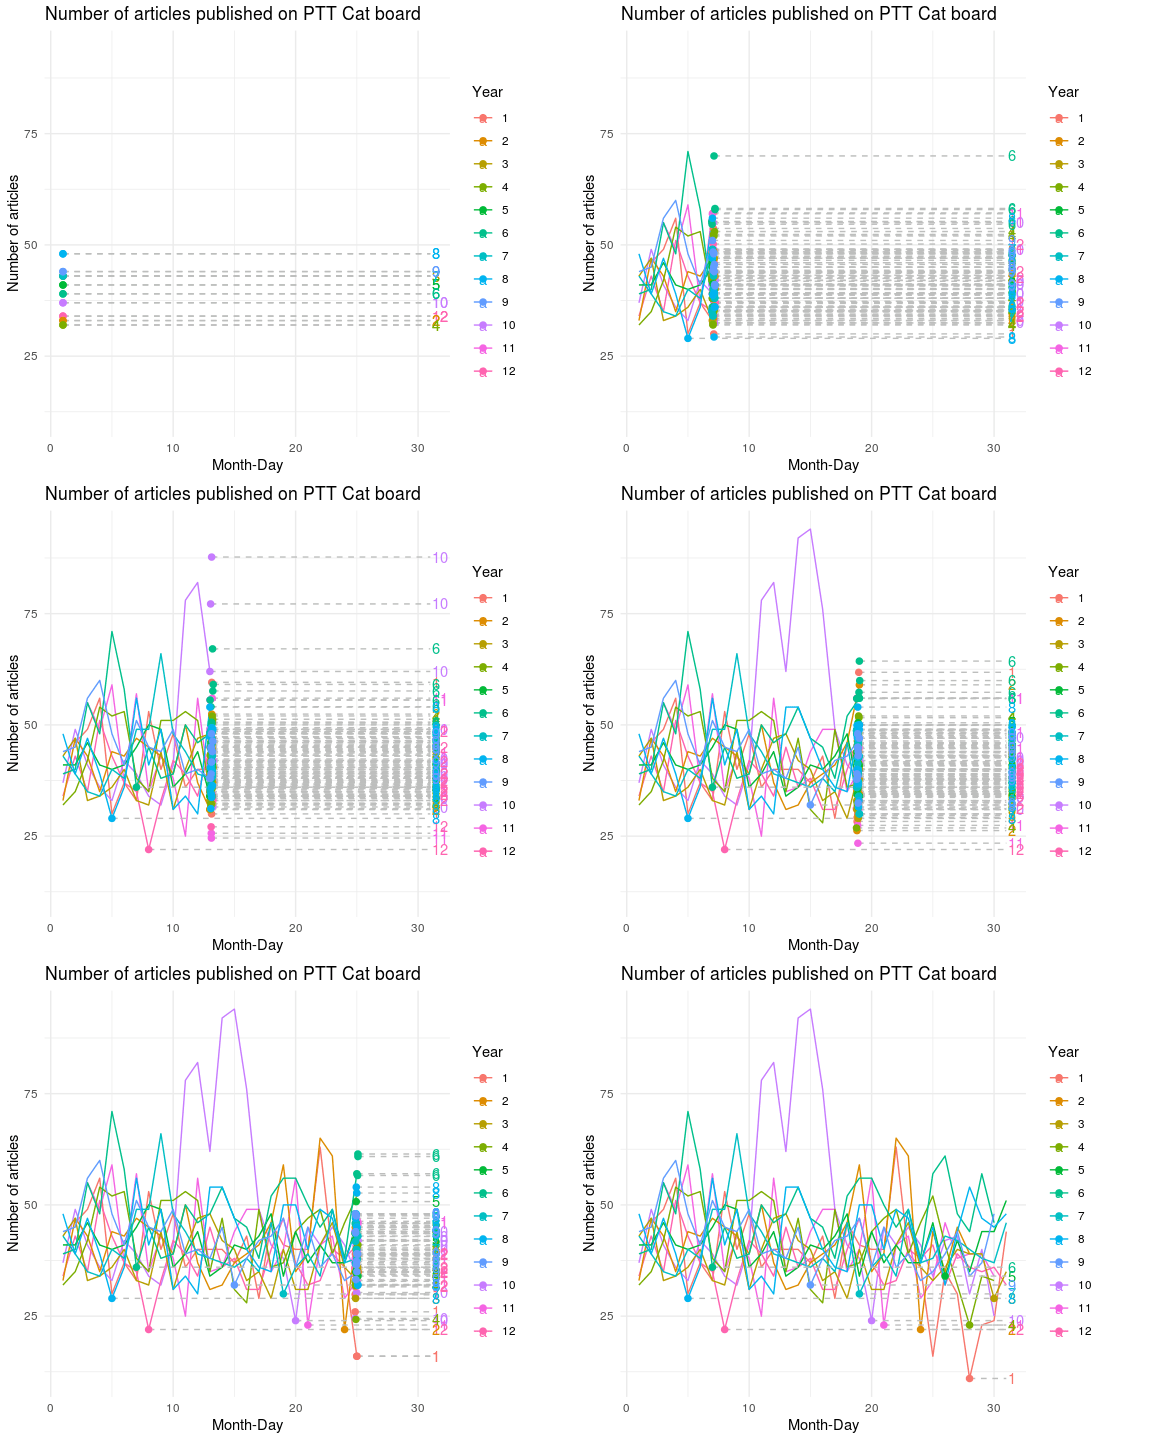
df2 <- df1 %>% filter(date_full>"2017-01-01"&date_full<="2017-12-31")
pl <- ggplot(df2, aes(date_d, number_of_articles, group=date_m_f, color=date_m_f)) +
geom_line() +
geom_segment(aes(xend = 31, yend = number_of_articles), linetype = 2, colour = 'grey') +
geom_point(size = 2) +
geom_text(aes(x = 31.1, label = date_m), hjust = 0) +
transition_reveal(date_d) +
coord_cartesian(clip = "off") +
labs(title = "Number of articles published on PTT Cat board",
x = "Month-Day", y = "Number of articles",
color = "Year") +
theme_minimal() +
theme(plot.margin = margin(5.5, 40, 5.5, 5.5))
gganimate::animate(pl)